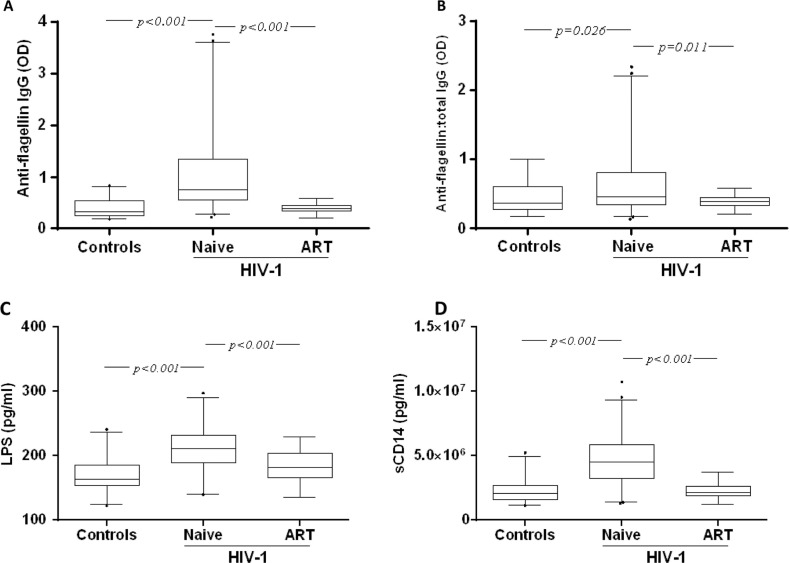
Figure 1.
Detection of plasma anti-flagellin IgG, lipopolysaccharide (LPS) and soluble CD14 (sCD14) in Vietnamese patients living with HIV-1 and in HIV-negative controls. Box plot representing the plasma levels of anti-flagellin IgG (A), the ratio of flagellin-specific IgG to total IgG (B), LPS (C) and sCD14 (D) in healthy controls (Controls), naïve individuals living with HIV-1 (Naïve) and individuals living with HIV-1 after 24 months of antiretroviral therapy (ART). Box plots display the median OD value and 25th and 75th interquartile ranges. Whiskers represent the 5th to 95th percentiles, and dots the outliers. The non-parametric Mann-Whitney test was used to compare the differences between patients and controls at baseline. The intragroup change from baseline to the end of the follow-up study was analyzed by a Wilcoxon test.

