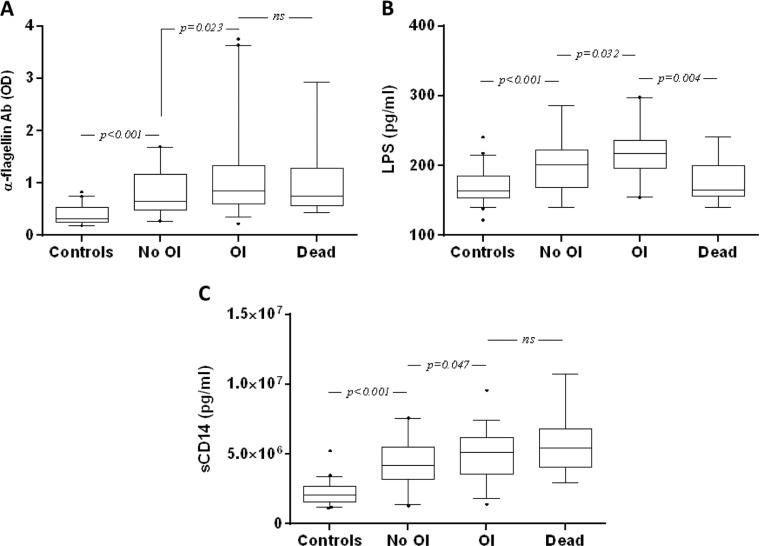
Figure 3.
Baseline markers in Vietnamese patients living with HIV-1 with and without new opportunistic infection (OI) development during antiretroviral treatment (ART). Box plot of OD values representing the plasma levels of anti-flagellin IgG (A), LPS (B) and sCD14 (C) concentrations in naïve Vietnamese patients living with HIV-1 who died (Dead), and those with (OI) or without (No OI) the development of OI. Box plots display the median value and 25th and 75th interquartile ranges. Whiskers represent the 5th to 95th percentiles, and dots the outliers. Pairwise comparisons refer to a Mann–Whitney U test.

