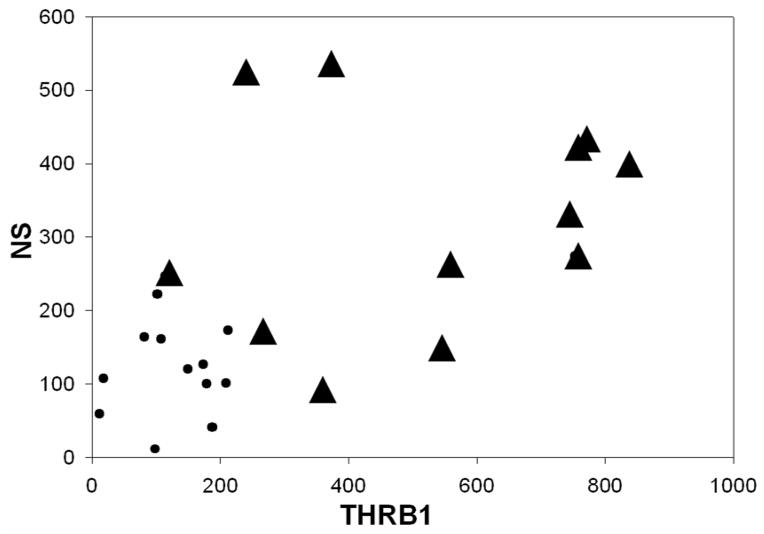
Figure 2. THR-β1 versus neuroserpin levels.
Correlative scatter plot of all AD brain samples (▲) comparing neuroserpin (densitometric units) versus THR-β1 (densitometric units) to those of age-matched control brain samples (●). Pair-wise correlation coefficient of NS Vs THRβ1 of all observations from AD and age-matched control brain homogenates were positively correlated with a Pearson’s r(24)=0.599; p=0.002

