
Figure 5. NS (A), THRβ1 (B), and HuD (C) protein concentrations from AD and age-matched control brains.
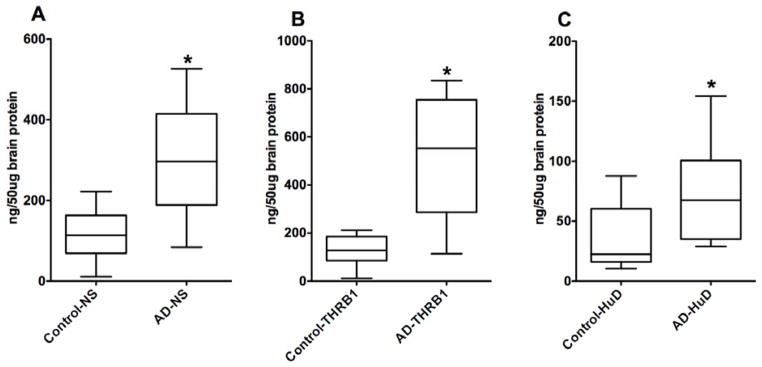
Values are means ± S.E.M. of twelve samples per group. Student t test was used to determine differences among brain tissue means (AD Vs Control) on each protein. The AD brain samples were significantly different from the control brain samples for each of the three brain proteins. An asterisk indicates that the mean is different (P<0.05) from that of the control.