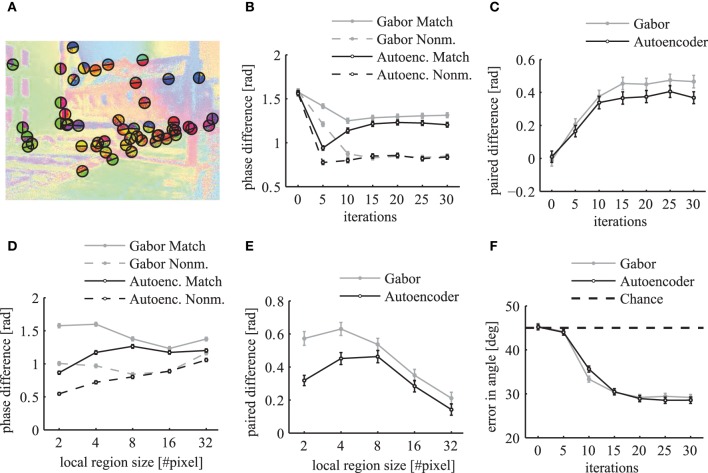
Figure 13.
Local evaluation of the phase segmentation. Results were obtained using Gabor filters (gray) and autoencoder filters (black). (A) Illustration of the randomly selected locations on segment borders and the corresponding semicircles as described in the main text. (B) The local phase difference at random segment border locations of matching images (solid lines) and non-matching images (dashed lines). (C) The paired difference between the local phase differences evaluated on matching and non-matching images. (D) The mean local phase difference as a function of different sizes of the local circular regions over which the phase is evaluated. (E) The paired difference between matching and nonmatching images. (F) The mean error in the estimated angle of segment boundaries. All errorbars are 95% confidence intervals.

