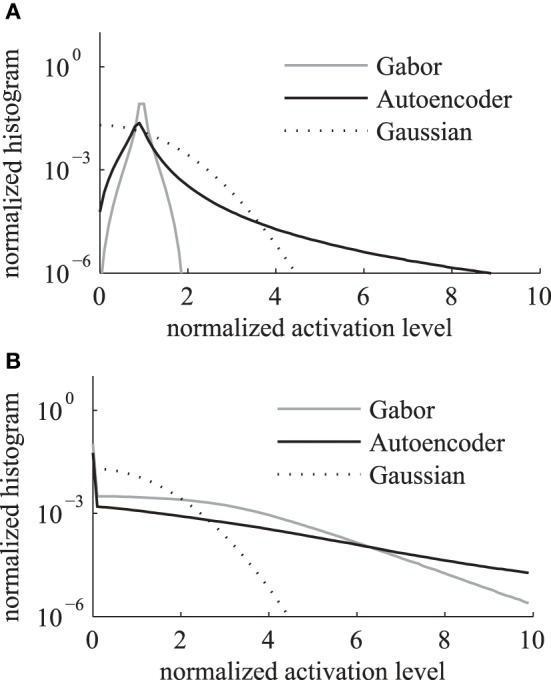
Figure 4.

Histogram of activation levels averaged over all feature types. The distributions of activation levels are compared to a Gabor distribution. (A) After sigmoidal activation function. (B) After mean subtraction, half-wave rectification and division by the sum.
