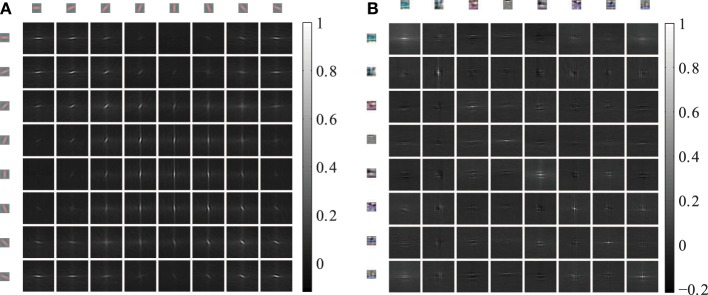
Figure 5.

Cross-correlations between different feature activations shifted in visual space. The shown cross-correlations are based on the activation levels induced by natural images. Only a subset of 8 features is shown. The patches on the top and left row show the forward weight matrix of the receptive fields. The other patches show the spatial correlation between these features. The feature weights are shown at the same spatial scale as the shifts in the cross-correlations. (A) The correlations between 8 oriented Gabor filters of one of the 6 color channels are shown. (B) The correlations between 8 randomly choosen autoencoder features are shown.
