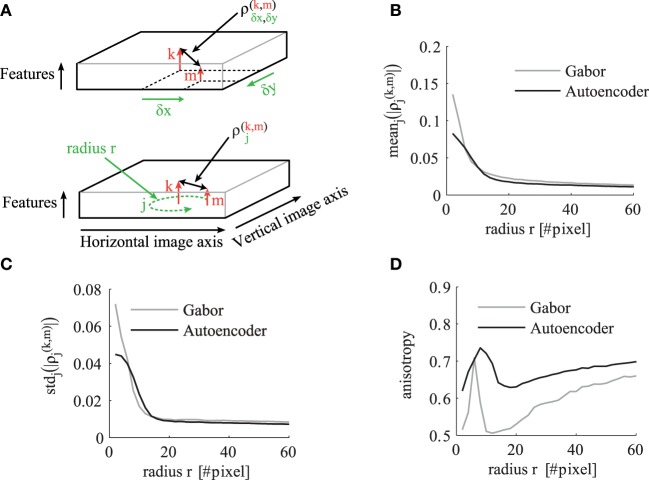
Figure 6.
The statistics of the correlation matrix evaluated for different distances r in visual space. (A) Schematic to illustrate the indices of the correlation tensor. In the top schematic the correlation tensor is indexed by horizontal (x) and vertical (y) offsets in visual space. In the bottom schematic the correlation tensor is indexed by j ∈ Rr for a certain distance r in visual space. The other panels compare the correlation tensor of Gabor filters (gray) and autoencoder filters (black) for different distances r. All shown statistics are averaged over all pairs of receptive field types k and m. (B) Mean over all directions. (C) Standard deviation over different directions for a certain pair of feature types. (D) The anisotropy averaged over all pairs of receptive fields as described in the main text.

