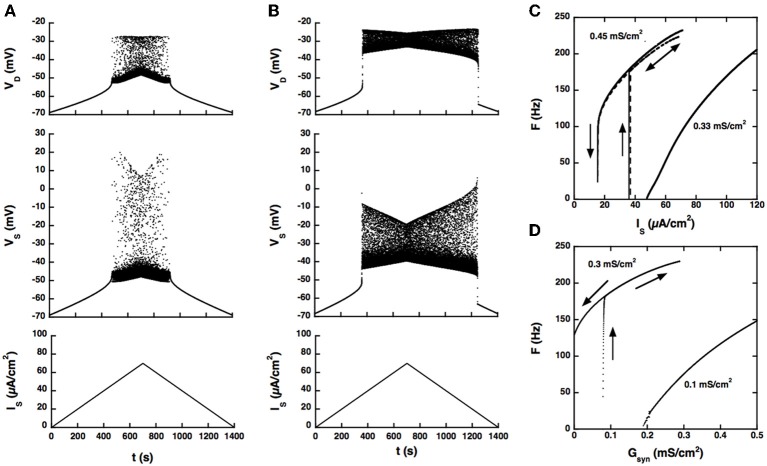
Figure 2.
Response of the strong coupling model (Gc = 1 mS/cm2) to excitatory input. (A) Voltage response to a triangular current ramp. Dendritic GCa−L is 0.33 mS/cm2 as in the BRK model. From bottom to top: current injected in the soma, soma voltage and dendritic voltage. The discharge is symmetrical, the recruitment current on the ascending ramp and the derecruitment current on the descending ramp differing by less than 1.5% (50.2 and 49.4 mV, respectively). (B) Same as A but GCa−L increased to 0.45 mS/cm2. The discharge is clearly asymmetrical. A dendritic plateau potential of 16 mV sets in at firing onset (IS = 38 μA/cm2). On the descending ramp, firing persists down to 20 μA/cm2. (C) F-I curves. Current ramp from 0 to 120 μA/cm2 and back. F-I curves (solid lines) are displayed for GCa−L = 0.33 (right), and 0.45 mS/cm2 (left). For this latter value,firing stops when the injected current reaches 70 μA/cm2 because of spike blockade. Decreasing the dendritic GK(Ca) from 0.7 to 0.25 mS/cm2 (with GCa−L kept at 0.33 mS/cm2, dashed line) has the same effect as increasing GCa−L from 0.33 to 0.45 mS/cm2 [with GK(Ca) kept at 0.7 mS/cm2]. (D) Synaptic excitation of dendrites. F-Gsyn curves are shown for GCa−L = 0.1 (right) and 0.3 mS/cm2 (left). No dendritic potassium conductance GK(Ca). Triangular conductance ramp from 0 to 0.5 mS/cm2 (i.e., equal to the leak conductance of dendrites) and back, velocity of 0.01 mS/cm2/s. Note that frequency plateaus are present near firing onset for GCa−L = 0.1 mS/cm2 as in the subprimary firing range of mouse motoneurons (Manuel et al., 2009). We showed that they are due to mixed mode oscillations in a previous paper (Iglesias et al., 2011). The ascending (upward pointing arrows) and descending branches (downward pointing arrows) of the hysteresis loops are indicated on panels (C,D) and on the following figures.

