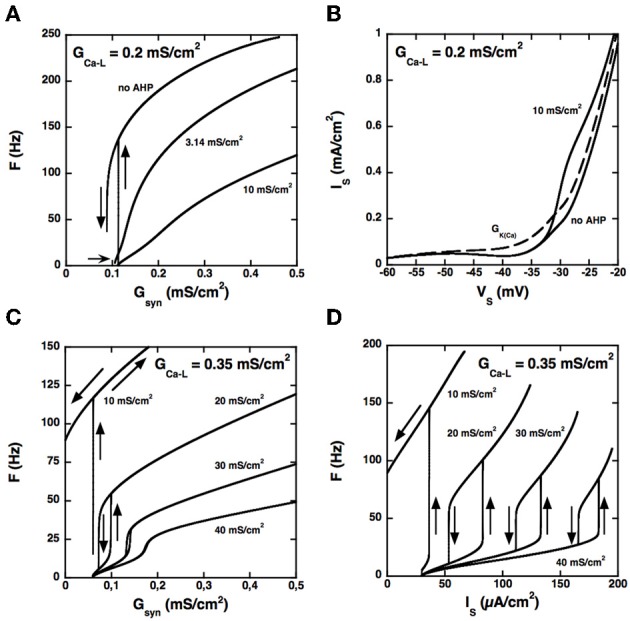
Figure 3.

Control of the firing pattern by the AHP conductance. (A) F-Gsyn curves for GCa − L = 0.2 mS/cm2. Somatic AHP conductance GAHP = 0.0, 3.14, and 10 mS/cm2 (see labels) but no potassium conductance in dendrites. For GAHP = 3.14 mS/cm2 (the same value as in the BRK model), the F-Gsyn curve is graded and displays only a tiny range of bistability below recruitment (thin arrow). When the AHP is suppressed, firing starts at 137 Hz, and the size of the bistability range considerably increases. In contrast, bistability disappears when GAHP is increased to 10 mS/cm2. (B) Somatic I–V curves. Same conditions as in (A). The curves obtained without AHP and for GAHP = 10 mS/cm2 (solid lines, see labels) differ only above −33 mV. In contrast, increasing the dendritic GK(Ca) to 0.7 mS/cm2 (in the absence of somatic AHP) suppresses the negative slope region of the I–V curve in the subthreshold voltage range [dashed line labeled GK(Ca)]. The curves are not hysteretic because a dendritic compartment strongly coupled to the soma cannot account for the distal dendritic component of the L-type current. This departure from realism is of little significance as we focus here on the interaction between the proximal component of the L-type current and the somatic AHP. (C) F-Gsyn curves for GCa − L = 0.35 mS/cm2. GAHP = 10, 20, 30, and 40 mS/cm2 (see labels). At variance with panel A, the F-Gsyn curves display a primary range of firing when GAHP is large enough to counterbalance the L-type current and has then a strong regulatory effect on the discharge. (D) F-I curves for GCa − L = 0.35 mS/cm2. Same as in D but current is injected in the soma. Note that the large AHPs at play create a wide primary firing range, in keeping with the traditional role of the AHP in firing rate control.
