Figure 2.

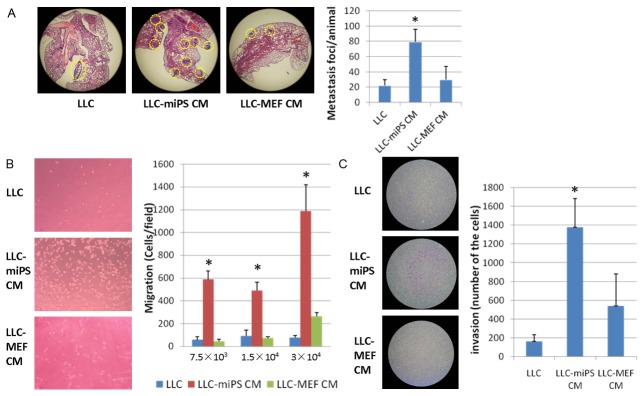
miPS microenvironment promoted LLC cells metastasis in vivo and in vitro. A. Lung metastatic foci were observed by microscopy in fifteen serial sections (n=3). Representative haematoxylin-and-eosin-stained sections of lungs of mice are shown in the left panel. Metastatic foci are delineated by a yellow dashed line. The average number of metastatic foci of LLC, LLC-miPS CM or LLC-MEF CM cells which were statistically significantly different are indicated by an asterisk (*, P<0.05). B. Transwell migration assay.7.5 × 103, 1.5 × 10⁴ or 3 × 10⁴ of LLC, LLC-miPS CM or LLC-MEF CM cells were added in the upper chambers, respectively. Quantification of the migration is expressed as the number of migrating cells to the lower chamber per high-power field (HPF; × 100), and significantly different indicated by an asterisk (*, P<0.05). Representative micrographs of the transwell migration assay (100 × magnification) are shown in the left panel. C. Transwell invasion assay. 1 × 10⁴ of LLC, LLC-miPS CM or LLC-MEF CM cells were added in the upper chambers, respectively. Quantification of the invasion is expressed as the number of invading cells in the membranes and statistic significant differences are indicated by an asterisk (*, P<0.05). Representative micrographs of the transwell invasion assay (40 × magnification) are showed in the left panel.
