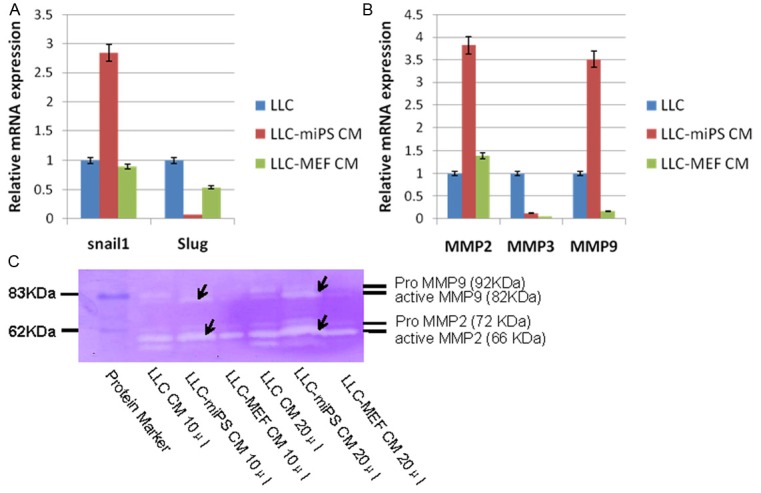
Figure 3.

miPS microenvironment up-regulated expression of Snail1, MMP2 and MMP9. A. Real-time PCR analysis of Snail1 and Slug in LLC, LLC-miPS CM and LLC-MEF CM cells. B. Real-time PCR analysis of MMP2, MMP3 and MMP9 in LLC, LLC-miPS CM and LLC-MEF CM cells. C. 10 μl and 20 μl medium of LLC, LLC-miPS CM and LLC-MEF CM cells were subjected to zymography using gelatin as a substrate. The molecular mass standard contains pro-MMP9 (92 kDa), active MMP9 (82 kDa), pro-MMP2 (72 kDa) and active MMP2 (66 kDa). Arrow is used to indicate the zymographic bands of active MMP9 and active MMP2.
