Figure 1.
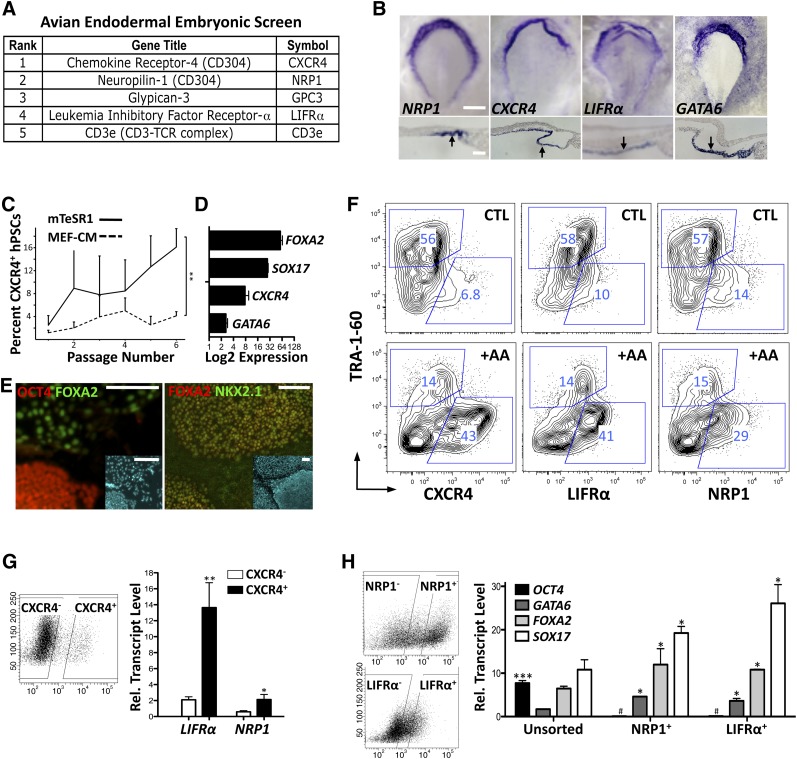
Evaluation of novel endoderm markers in the embryo and in human embryonic stem cells (hESCs); priming to definitive endoderm. (A): Cell surface receptors identified by an avian embryonic screen and tested in hESCs. (B): Expression analysis of NRP1, CXCR4, LIFRα, and control GATA6 by whole-mount RNA in situ hybridization at stage HH4 in avian embryos. Transverse sections (lower panels) confirm staining to the lower endodermal cell layer (arrows). Scale bars = 500 μm (top panels) and 50 μm (bottom panels). (C): Emergence of stable CXCR4-positive population in hESCs in mTeSR1. Grouped flow cytometry values from CA2, H9, and iPS1.2 evaluated by analysis of variance (∗∗, p <.01). (D): Summarized quantitative polymerase chain reaction data from CA2, H9, and iPS1.2 demonstrating increased endodermal marker expression in mTeSR1. (E): Immunofluorescence of primed H9 cells showing OCT4-positive colonies negative for regions of FOXA2-positive endoderm. FOXA2 expression overlaps with anterior foregut endoderm marker NKX2.1. Insets stained with 4′,6-diamidino-2-phenylindole show total cell numbers. Scale bars = 50 μm. (F): Flow cytometry analysis of CXCR4, LIFRα, and NRP1 versus TRA-1-60 in H9 cells adapted to mTeSR1 with and without 5-day treatment of 100 ng/ml AA. Endodermal markers expressed in basal conditions are augmented by AA, whereas TRA-1-60 is diminished. (G): Correlation of expression of LIFRα and NRP1 with CXCR4-positive sorted CA2 cells (sorting gates shown on left). (H): Expression of pluripotency (OCT4) and endodermal markers in primed CA2 cells sorted for NRP1 and LIFRα (gating shown on left). Endodermal markers are higher in sorted populations, whereas OCT4 expression is lower. Bar graphs show mean + SEM. ∗, p <.05; ∗∗∗, p <.001; #, lower expression in sorted cells (p <.01); two-tailed Student’s t test. Abbreviations: +AA, plus activin A; CTL, control; hPSCs, human pluripotent stem cells; MEF-CM, mouse embryonic fibroblast-conditioned medium.

