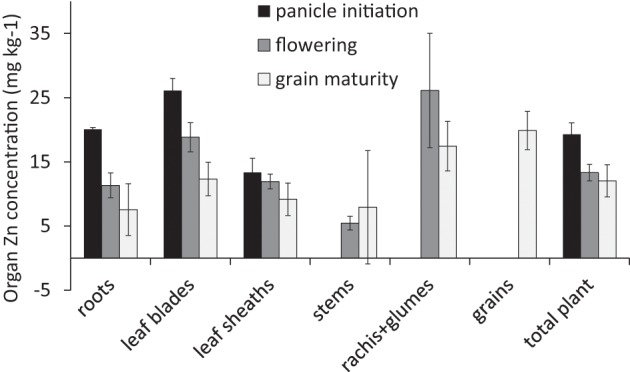
Figure 1.

Zinc concentrations (mg kg−1) in the different organs at three harvests averaged across the different 70Zn application treatments (Experiment 1). Error bars indicate standard errors where n = 2, 4, and 6 at panicle initiation, flowering, and grain maturity, respectively.
