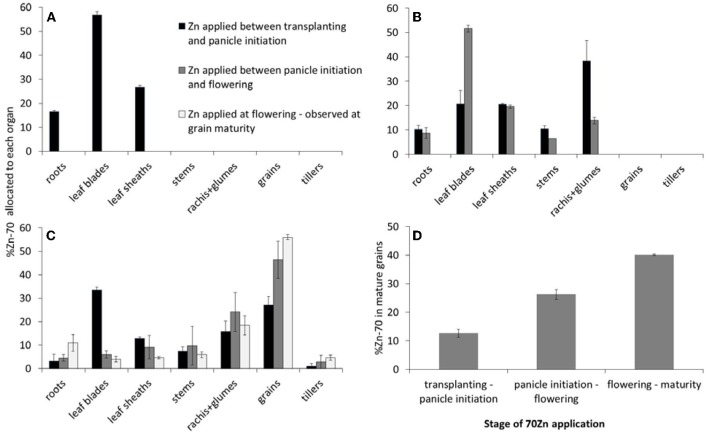
Figure 2.
Allocation of 70Zn as observed by destructive sampling at 1 week after panicle initiation (A), at flowering (B), and at grain maturity (C), and as influenced by the period during which the plants received the 70Zn (D) (Experiment 2). Panel (D) shows the calculated percentage of total grain 70Zn at grain maturity that can be traced back to 70Zn that was applied during the three distinguished development stages. Error bars indicate standard errors (n = 2).

