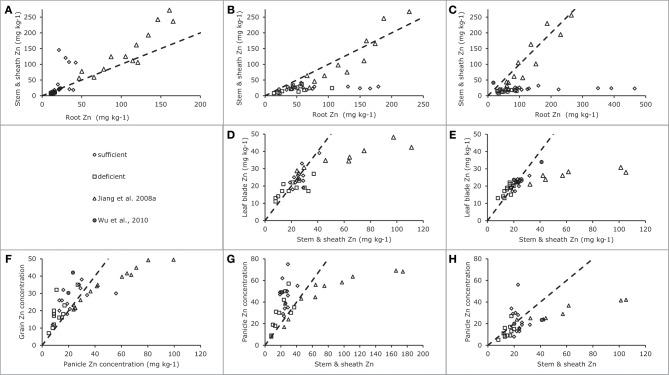
Figure 5.
Zinc concentrations in generative plant tissues as indicated along the axes for data from Impa et al. (2013), Wu et al. (2010) and Experiment 4 [see also Jiang et al. (2008a)]. Panel (A) for plants harvested during the early vegetative stage, Panels (B), (D), and (G) for plants harvested at flowering and Panels (C), (E), (F), and (H) for plants harvested at grain maturity. Data points from Impa et al. (2013) represent averages per tested genotype grown at either sufficient (diamonds) of deficient (squares) Zn nutrition, data points from Wu et al. (2010) (filled circles) represent averages of two genotypes grown at sufficient Zn nutrition and data points from Jiang et al. (2008a). (Experiment 4) (triangles) represent averages for two genotypes grown at a range of Zn nutrition levels. The broken lines indicate the 1:1 line in each panel.

