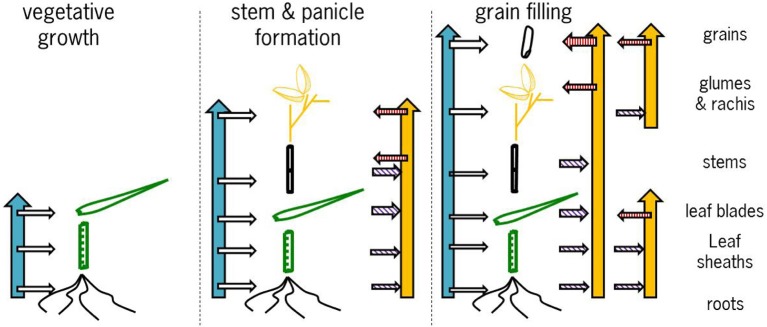
Figure 7.

Graphical representation of the proposed conceptual model of allocation and re-translocation of zinc during the subsequent stages of cereal development. The blue vertical and the horizontal arrows to the left of each panel indicate uptake and direct allocation to individual tissues, while the yellow vertical arrows to the right of each panel indicate re-allocation flows. The horizontal arrows with purple hatching indicate when tissues are a source of Zn for re-translocation and the horizontal arrows with a red hatching indicate when tissues are sink for Zn from re-translocation. For further explanation see the text.
