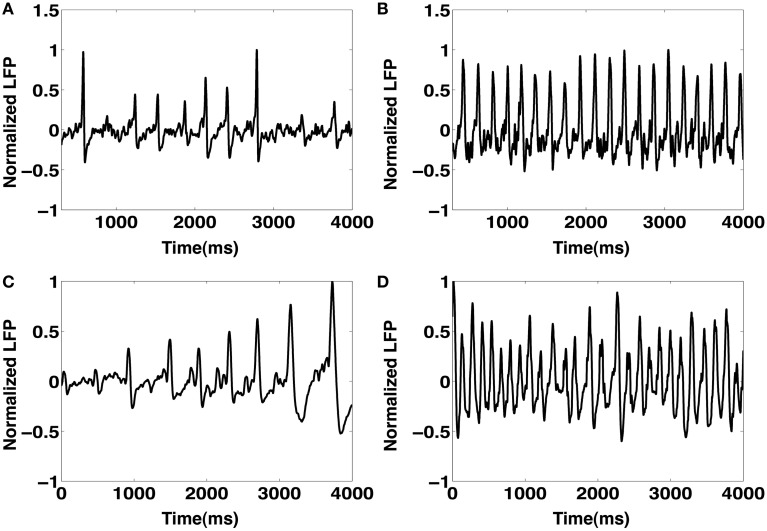
Figure 13.
(A) A sequence of spontaneous IIS-like events produced from the CA1 network model. (B) An example of the CA1 model generated tonic ictal-like activity in the theta range. This is primarily produced by increasing the frequency of SC input drive to the CA1 (@ 30 Hz). (C) Sequence of IIS events observed in an EEG recording of a rat induced with TLE. (D) EEG recordings of the tonic phase of an ictal event.

