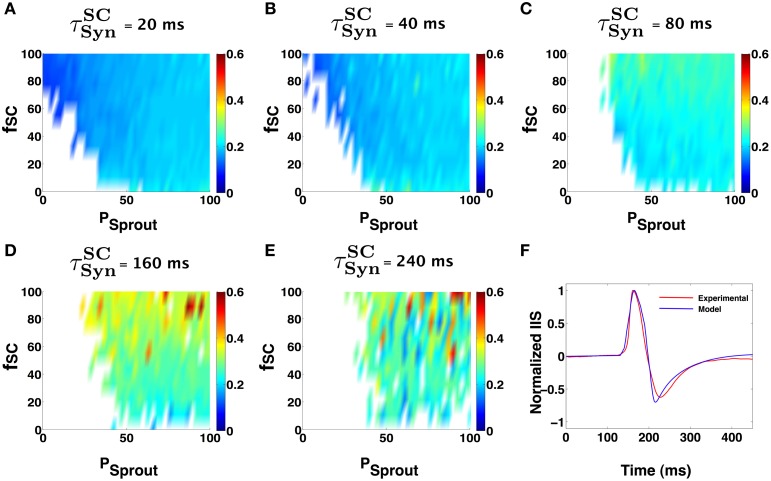
Figure 6.
Similar network parameter IIS trends seen in the case of the Golomb Py model (Figure 5), can be observed using the Nowacki model for the bursting Py cells. (A–E) Show IIS RMSE with the mean experimental IIS, color coded maps in terms of network parameters and input synchronization (jitter). In each of the colormaps for a fixed input window (tSCSyn), the input percentage from SC to pyramidal cells (fSC), and the degree of sprouting (Psprout) was varied. (F) Shows an example model generated IIS in comparison with the mean experimental IIS.

