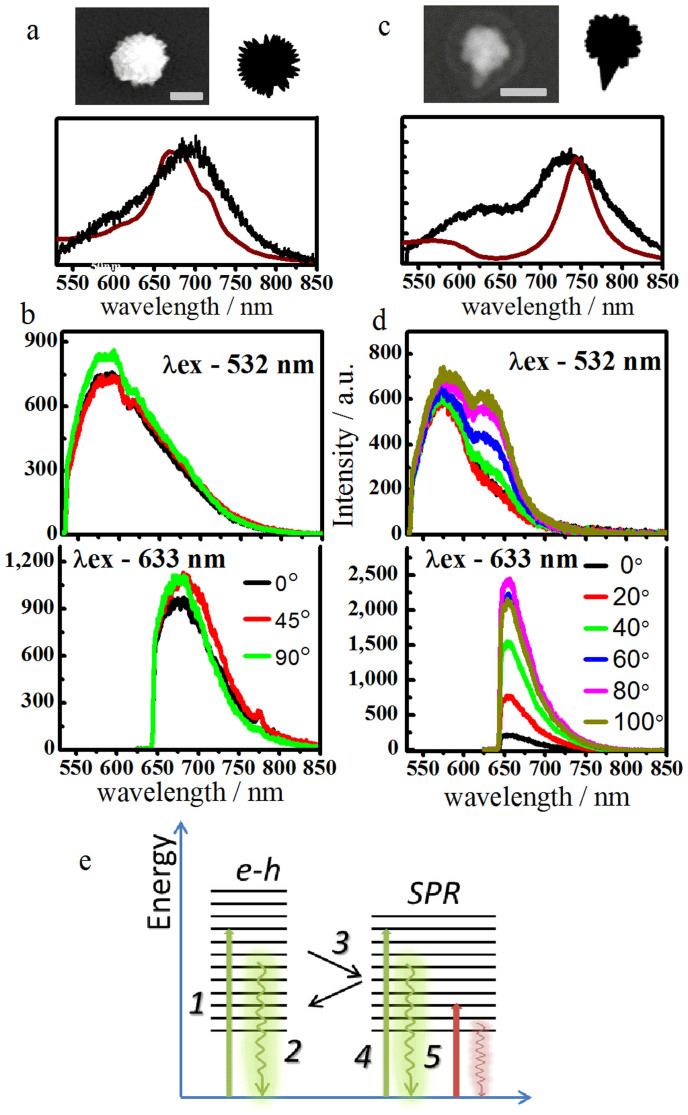
Figure 2. Photoluminescence spectra of two representative AuNFs excited by a CW 532 nm laser and a 633 nm laser.
(a) and (c) are the SEM images of the AuNFs and their modeled geometries for the numerical simulation; the scale bars in the SEM images represent 100 nm. The experimental dark-field scattering of the AuNFs is plotted in black, while the theoretical simulation extinction spectra are shown in brown. (b) and (d) are the PL spectra of the corresponding AuNFs under excitation with different polarization angles. (e) Schematic diagram of radiative decay channels with different excitation wavelengths. The solid green lines represent excitation with the 532 nm laser, which excites both interband transitions by creating e–h pairs and the LSPR modes. The solid red line depicts the direct excitation of the LSPR with the 633 nm laser. The wavy lines represent emission from two decay channels.

