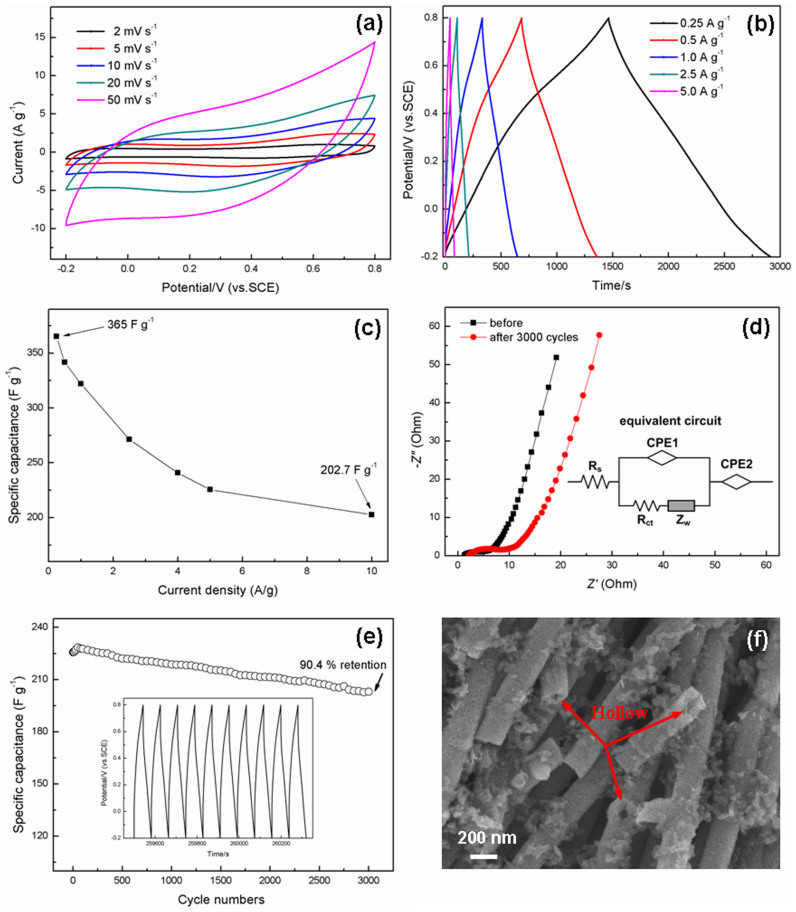
Figure 4.
(a) Cyclic voltammograms of MnO2 nanotubes in a 1 M Na2SO4 aqueous electrolyte. (b) Charge-discharge curves of MnO2 nanotubes at different current densities. (c) Specific capacitance of MnO2 nanotubes measured under different current densities. (d) Electrochemical impedance spectrum of the MnO2 nanotubes electrodes at open circuit potential in the frequency range from 0.01 Hz to 100 kHz. The inset shows the equivalent circuit. (e) Cycling performance of MnO2 nanotubes at the current density of 5 A g−1. The inset shows the charge-discharge curves of the last 10 cycles of the MnO2 nanotubes electrode. (f) The corresponding SEM image of the electrode after 3000 electrochemical cycles.

