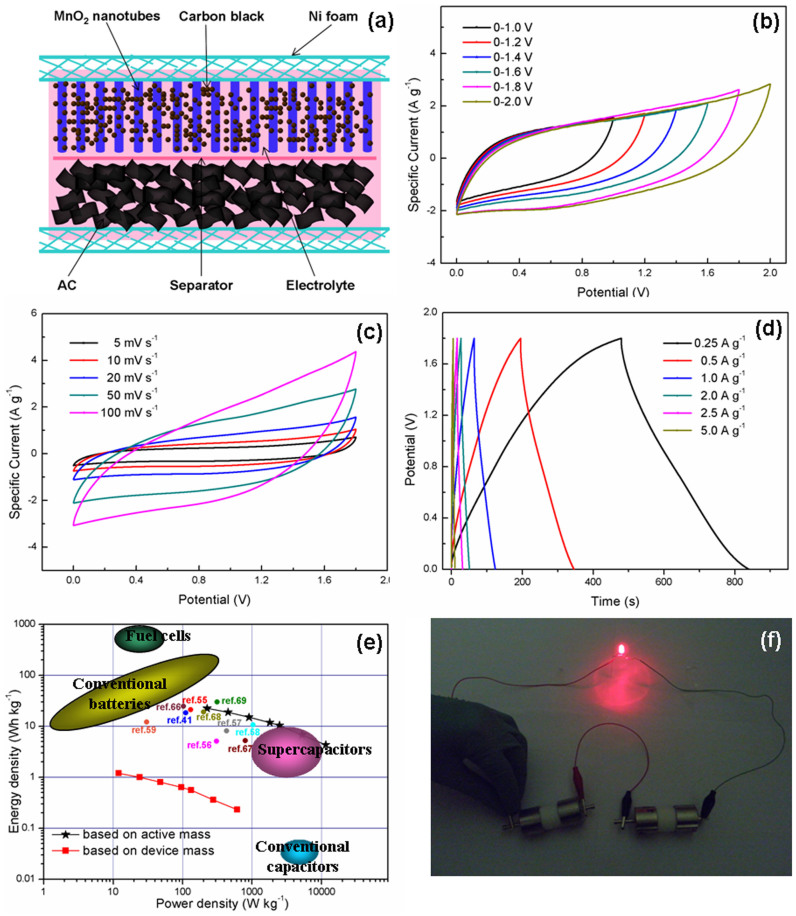
Figure 5.
(a) Schematic illustration of the asymmetric supercapacitor configuration. (b) CV curves of MnO2 nanosheets-bulit nanotubes//AG asymmetric supercapacitor measured at different potential window at a scan rate of 50 mV s−1. (c) CV curves of the asymmetric supercapacitor measured at different scan rates between 0 and 1.8 V. (d) Galvanostatic charge-discharge curves at different current densities. (e) The energy density vs. power density of the MnO2 nanotubes//AG asymmetric supercapacitor in a Ragone plot for fuel cells, conventional batteries, conventional capacitors, and ultracapacitors. (f) Digital image of a red-light-emitting diode (LED) lighted by the MnO2 nanotubes//AG device.

