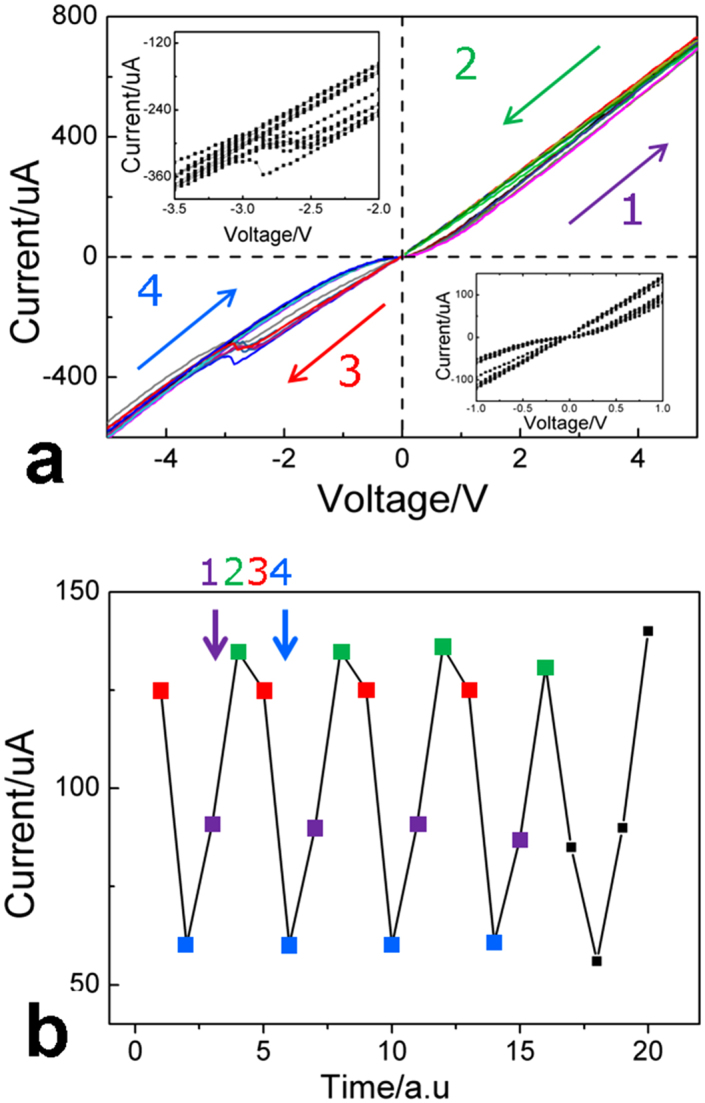
Figure 3. Resistance switching in LSTO/STON device during the in situ TEM experiment.

(a), I-V curve from −5 V to 5 V for five cycles, where the arrows and numbers indicate the sequence and the insets show the detail from −3.5 V to −2 V and from −1 V to 1 V, respectively. (b), The current variation under ±1 V, where the numbers indicate the corresponding sequences in Fig. 3 a.
