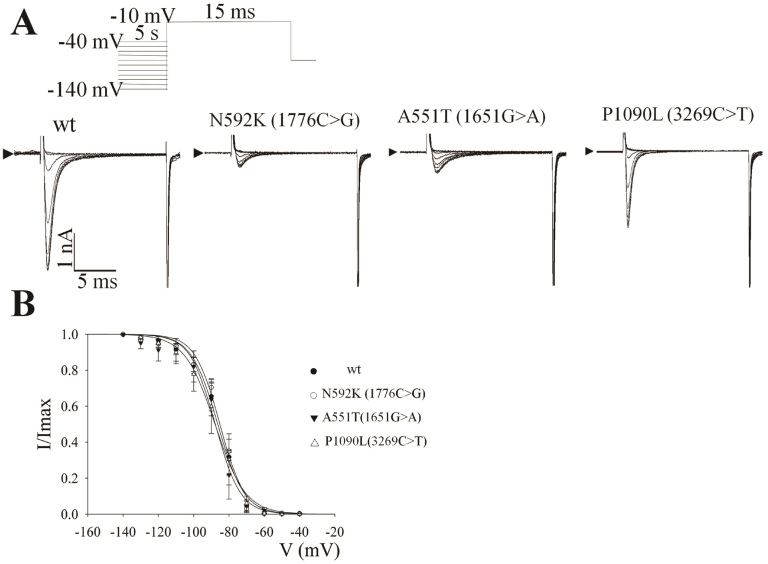
Figure 4. Effect of the mutations on the steady-state inactivation of the human cardiac sodium channel.
(A) Representative current traces. The protocol used is shown in the inset. (B) The steady-state inactivation curves of the wild-type and mutant Nav1.5. The typical current traces of wild-type protein were elicited by a brief 25 msec step pulse to −10 mV after a 3 sec prepulse to clamp the sodium channel to a steady-state inactivation status. The current amplitude was normalized to the maximum value elicited at −130 or −140 mV and the normalized curves were fit to the Boltzmann equation.

