. 2013 Jul-Sep;34(3):177–179. doi: 10.4103/0971-5851.123723
Copyright: © Indian Journal of Medical and Paediatric Oncology
This is an open-access article distributed under the terms of the Creative Commons Attribution-Noncommercial-Share Alike 3.0 Unported, which permits unrestricted use, distribution, and reproduction in any medium, provided the original work is properly cited.
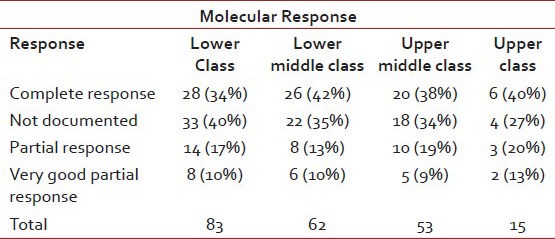
Table 5b.
Shows molecular response as per socioeconomic status

