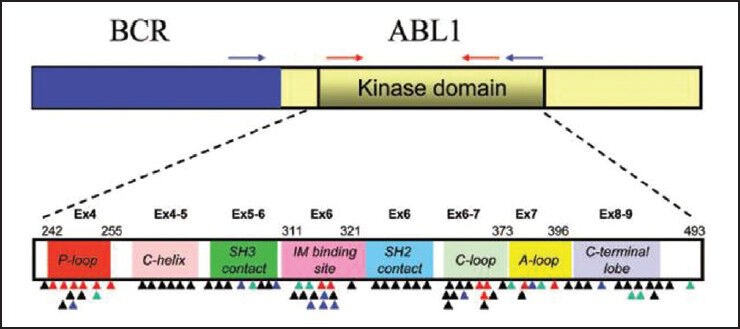
Figure 1.

Schematic representation of the BCR-ABL transcript and the location of reported kinase domain (KD) mutations (The location of primers used for nested real-time polymerase chain reaction are indicated on the BCR and ABL genes. The external primers (blue arrow) are placed on BCR and ABL region of the fusion transcript. The internal primers (red arrows) are used to further amplify KD region of the fusion transcript. Colored triangles indicate the location of KD mutations reported in tyrosine kinase inhibitor (TKI)-resistant samples (black for imatinib, green for nilotinib/imatinib, blue for dasatinib/imatinib and red for all three TKIs). The KD subdomains, exons and amino acid numbers are shown. P-loop: Phosphate binding loop; IM binding site: Imatinib binding region; C-loop: Kinase catalytic domain; and A-loop: Activation loop [Adapted from Jones et al. (2009) J Mol Diag Vol.11, No. 1: 4-11])
