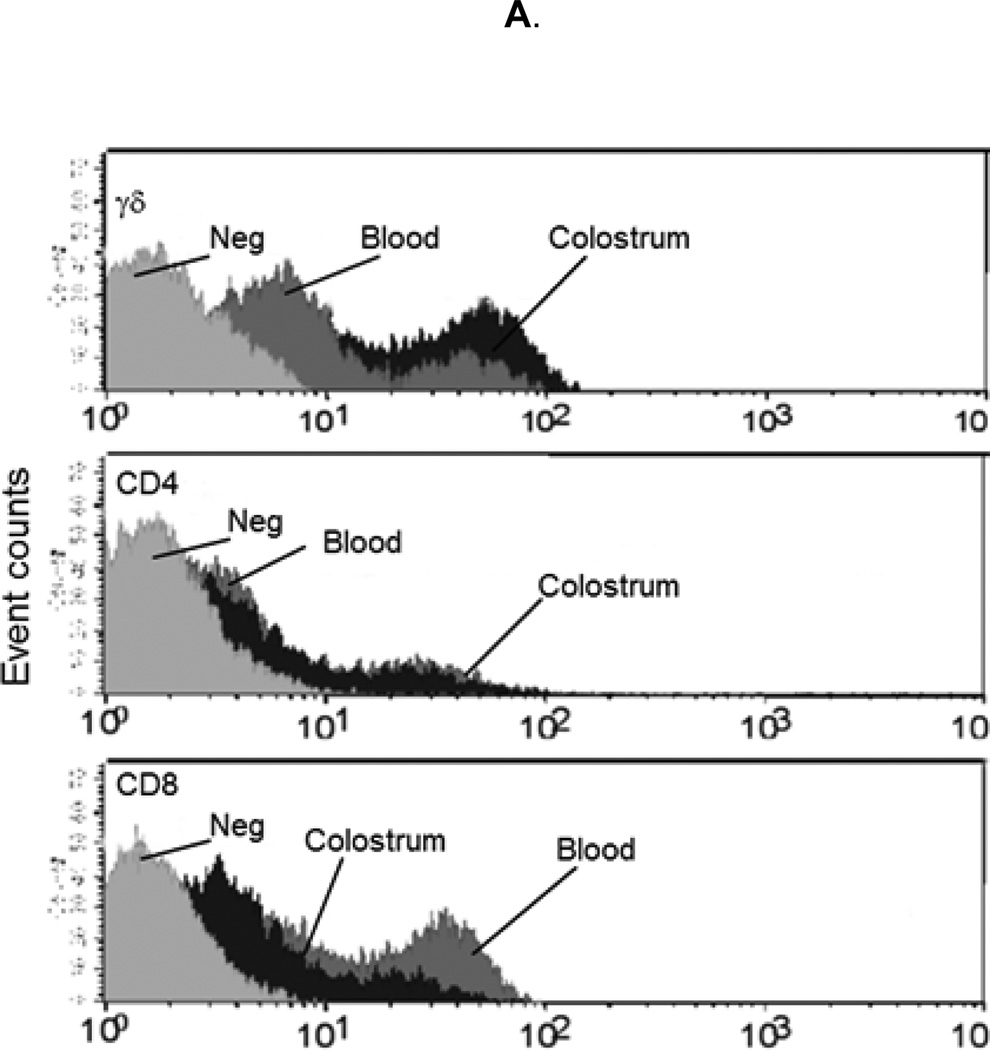
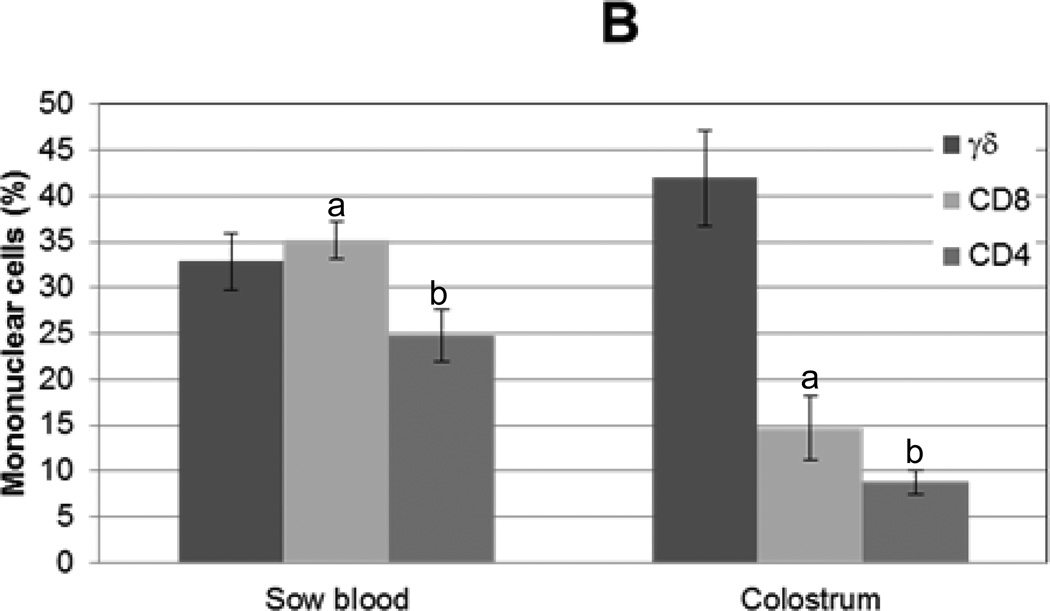
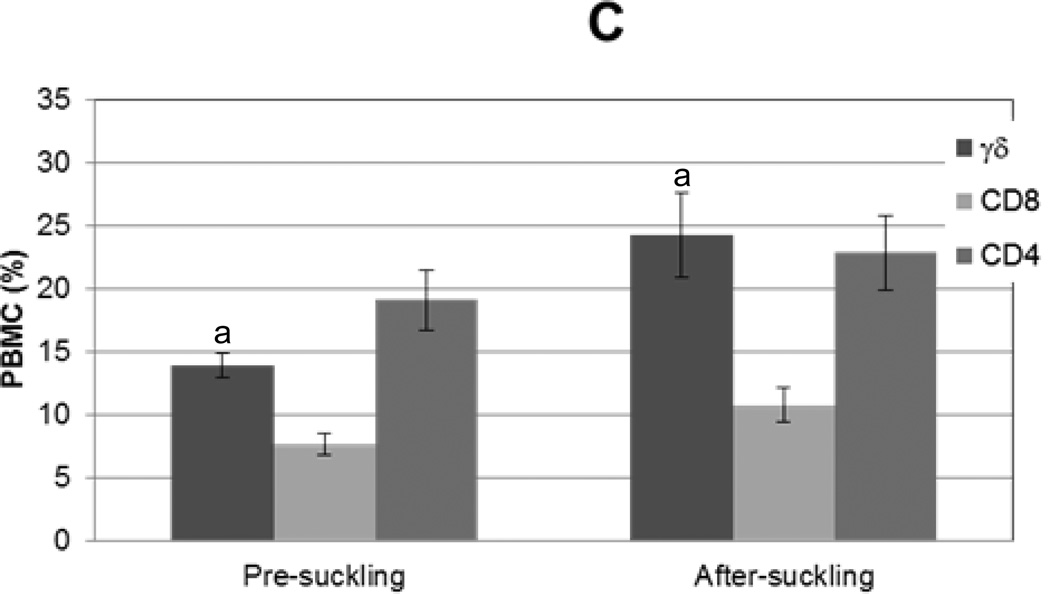
Figure 1. T lymphocyte distribution in sow blood and colostrum and in piglet blood before and after colostrum ingestion.
Mononuclear cells were isolated from sow blood or colostrum, phenotyped with swine specific γδ, CD8, or CD4 monoclonal antibodies (n=16), and analyzed via flow cytometry. (A) Representative flow cytometric analysis of T lymphocyte subpopulations in sow blood (dark gray) and colostrum (black); light gray represents unstained control. (B) Percentages of T lymphocyte subsets in sow blood and colostrum, n=16. (C) Percentages of T lymphocyte subsets in blood from piglets prior to colostrum ingestion (pre-suckling) and again at 24 h (after-suckling), n=34.Variance is given by standard error. Samples with same letters are significantly different; for samples marked “a,” p=0.001, for samples marked “b” p=0.0001.


