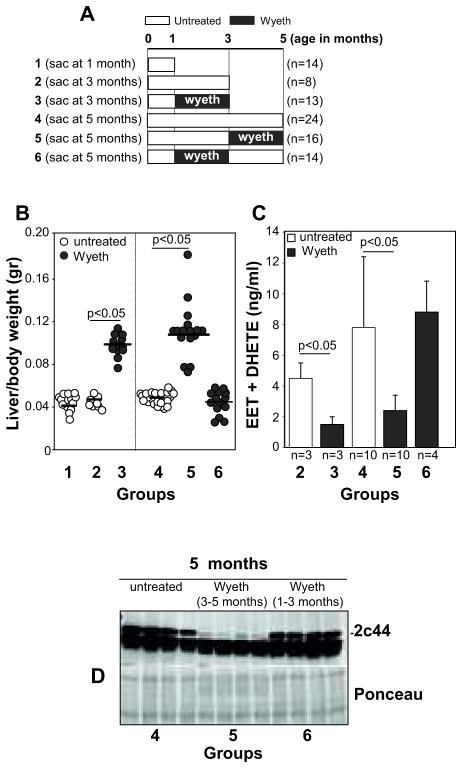
Figure 2. Treatment of KRasLA2 mice with Wyeth-14,643.
(A) Diagram showing the Wyeth-14,643 treatment protocol used in KRasLA2 mice. The number of mice/group is indicated in parenthesis. (B) Liver/body weight ratio of the KRasLA2 mice described in (A). Circles show individual values, while bars show mean values (C). Levels of EETs and DHETs in the plasma of the KRasLA2 mice described in (A). Values are averages ± SD of the mice indicated. (D) Hepatic microsomal fractions (20 μg/lane) of the KRasLA2 mice indicated were analyzed by Western blot for expression of Cyp2c44. Ponceau staining shows equal loading.

