
Figure 1.
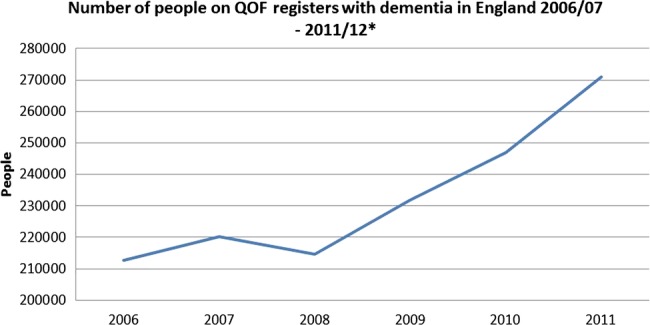
English National diagnosis numbers, 2006/2007 to 2011/2012. *y Axis begins at 200 000 as this was the baseline for numbers on the quality outcomes framework.
Official websites use .gov
A
.gov website belongs to an official
government organization in the United States.
Secure .gov websites use HTTPS
A lock (
) or https:// means you've safely
connected to the .gov website. Share sensitive
information only on official, secure websites.
English National diagnosis numbers, 2006/2007 to 2011/2012. *y Axis begins at 200 000 as this was the baseline for numbers on the quality outcomes framework.