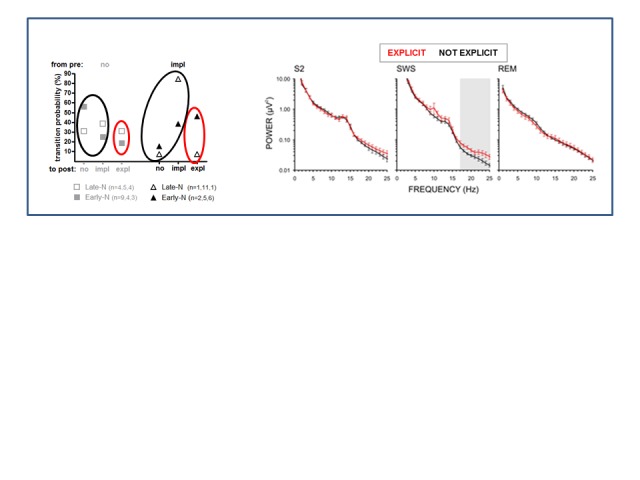
Figure 10.

Power spectrum of sleep EEG for explicit rule-discoverers versus all other participants. The left part of the figure repeats Figure 9, in order to clarify which subgroups’ data are depicted, by encircling the participants who contributed to black and red values in the power spectrum (right part) by black and red ellipses, respectively. Discoverers are 13 “expl-post” participants (in red), non-discoverers are all other 33 participants (in black). (EEG could not be analyzed in one of the 14 expl-post participants and in eight of the other 41 participants.) Depicted is the grand average power spectrum (across electrodes C3 and C4) for three sleep stages: S2, SWS, and REM. Shaded area in SWS indicates the frequency range of significant differences between non-solvers and solvers. Standard error bars are presented for each frequency bin.
