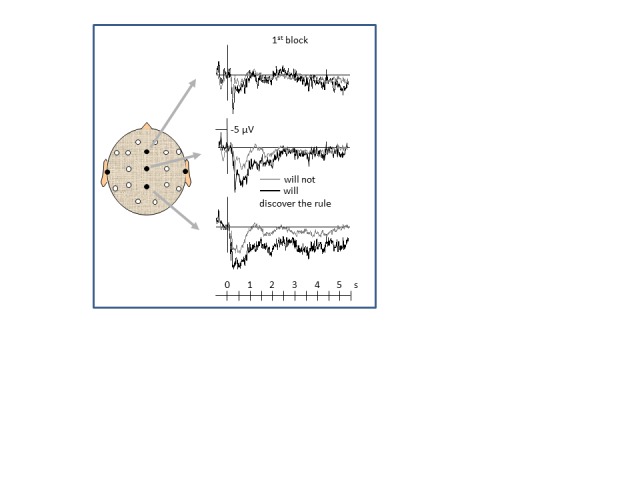
Figure 4.

Grand mean ERPs of the first block during the first seconds of each trial, separately averaged across the six participants who will later discover the rule (black lines) and those 20 participants who will not (gray lines). Time point zero denotes presentation of the first digit pair, 500 ms after the warning signal. Negativity is plotted upwards.
