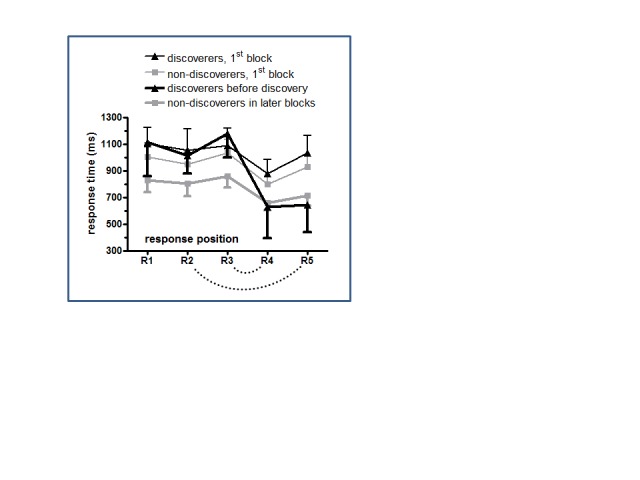
Figure 5.

Means and 95% confidence intervals of response times across participants. Black lines denote rule-discoverers, gray lines denote non-discoverers. Thin lines denote the first block, bold lines denote the block before insight. The dotted arcs connect responses that are identical according to the covert rule (R3 & R4, R2 & R5).
