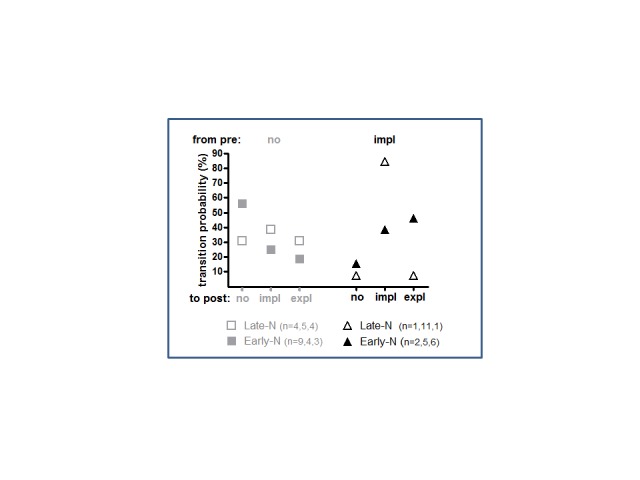
Figure 9.

Frequencies of transition from knowledge stages in the first session to knowledge stages in the second session. Knowledge stages in the first session are: no knowledge (grey, left side) or implicit knowledge (black, right side). Knowledge stages in the second session are: no, implicit, or explicit knowledge (from left to right on the x-axis). Solid symbols are for the early-night group, dashed symbols for the late-night group. The indicated percentages depict the number of participants in each of the three sub-groups (no-, impl-, expl-post) relative to their total number.
