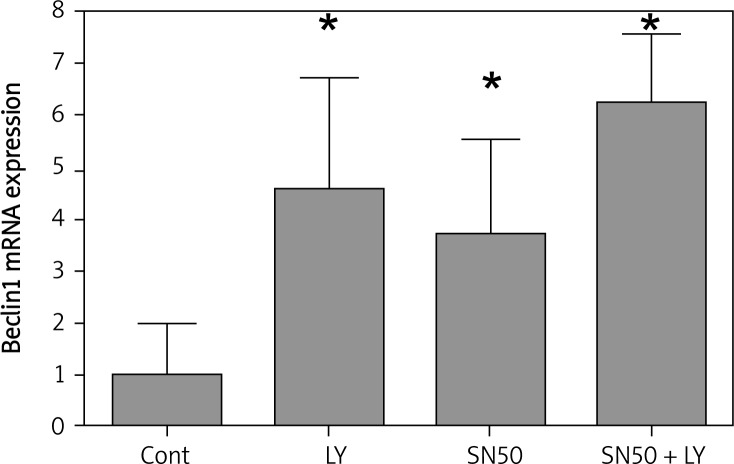
Figure 4.
Real-time quantitative RT-PCR analysis of the autophagic gene Beclin1 of the control and drug treated SGC7901 cells. Cells were treated with LY294002 (50 μmol/l), SN50 (18 μmol/l) and LY294002 + SN50 for 6 h. Values were given as mean ± SD of three independent experiments. Statistical analysis was carried out with ANOVA followed by Student t-test
*p < 0.05 compared to control group

