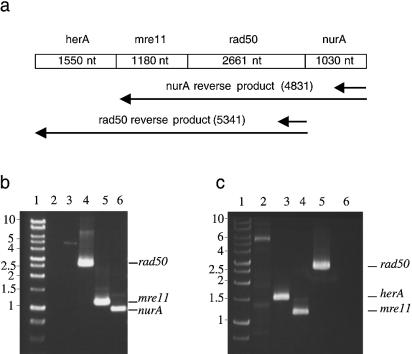
Figure 3.
Co-transcription of S.acidocaldarius herA, mre11, rad50 and nurA genes. (a) Schematic representation of RT–PCR products obtained using either a nurA- or a rad50-specific primer for the RT reaction. (b and c) Analyses of RT–PCR products. (b) Lane 1, DNA ladder; lane 2, control PCR using 5′mre11 and 3′nurA primers on S.acidocaldarius total RNA; lanes 3–6, PCR products obtained with nurA reverse products and the following primers: lane 3, 5′mre11 and 3′nurA primers; lane 4, rad50 primers; lane 5, mre11 primers; lane 6, nurA primers. (c) Lane 1, DNA ladder; lanes 2–5, PCR products obtained with rad50 reverse products and the following primers: lane 2, 5′herA and 3′rad50 primers; lane 3, herA primers; lane 4, mre11 primers; lane 5, rad50 primers; lane 6, control PCR using 5′herA and 3′rad50 primers on S.acidocaldarius total RNA.

