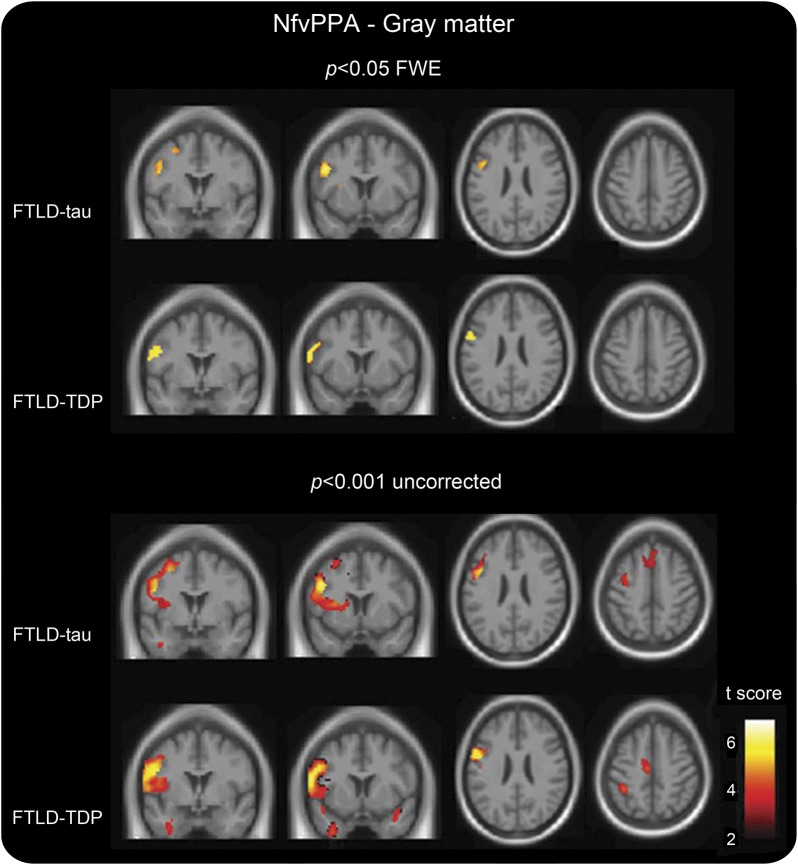
Figure 1. Gray matter atrophy in nfvPPA pathologic subtypes vs controls.
Voxel-based morphometric analysis on gray matter regions in nfvPPA pathologic subtypes relative to healthy controls. Statistical maps have been thresholded at p < 0.05 for FWE (top) and at p < 0.001 uncorrected (bottom). Statistical maps have shown in the coronal (coordinates [mm]: +0, +8) and axial (coordinates [mm]: +24, +48) sections of a T1-weighted MRI template image in DARTEL space. The color bar (hot) represents the t score. DARTEL = diffeomorphic anatomical registration through exponentiated lie; FTLD = frontotemporal lobar degeneration; FWE = familywise error; nfvPPA = nonfluent variant of primary progressive aphasia; TDP = transactive response DNA binding protein of 43 kD type A.

