
Figure 2.
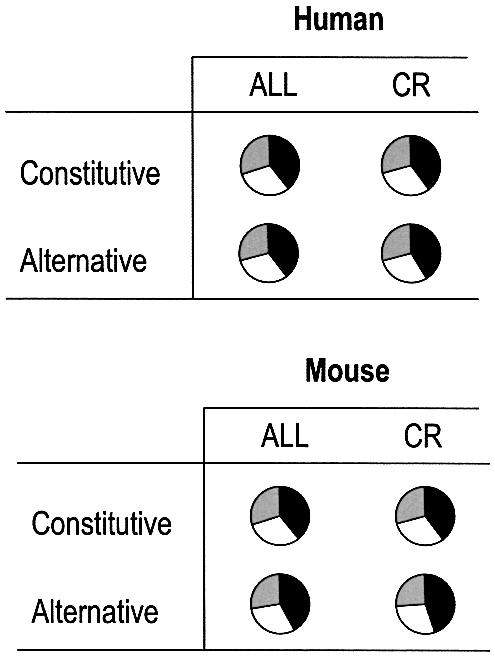
Genome-wide analysis of exon frame-preservation in human and mouse. Data for human (top) and mouse (bottom) are subdivided into constitutive exons (Constitutive) versus alternatively spliced single-exon skips (Alternative). CR indicates the subset of exons within each group that are within the protein coding region. Each pie chart shows the fraction of exons whose lengths are frame-preserving (exon length an exact multiple of 3 nt, black), versus frame-switching (white, gray).