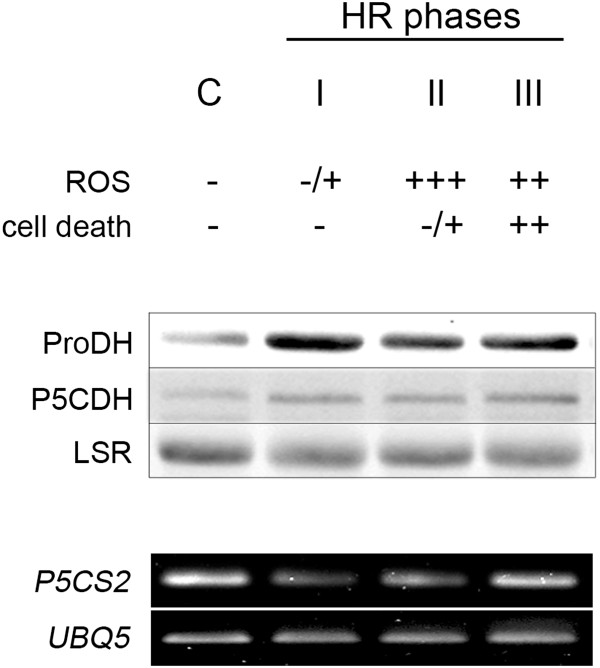
Figure 1.

Pro metabolic enzymes at three phases of HR triggered by Pst-AvrRpm1. Top: Three phases of the HR (I, II, III) having different ROS and cell death levels were selected as indicated in Additional file 1A. C: uninoculated (control) samples. Middle: ProDH and P5CDH content was quantified by Western blots using 30 μg of proteins per sample. Bottom: P5CS2 gene expression was analyzed by semi-quantitative, and quantitative RT-PCR (Additional file 1B) using primers and conditions described in Additional file 5.
