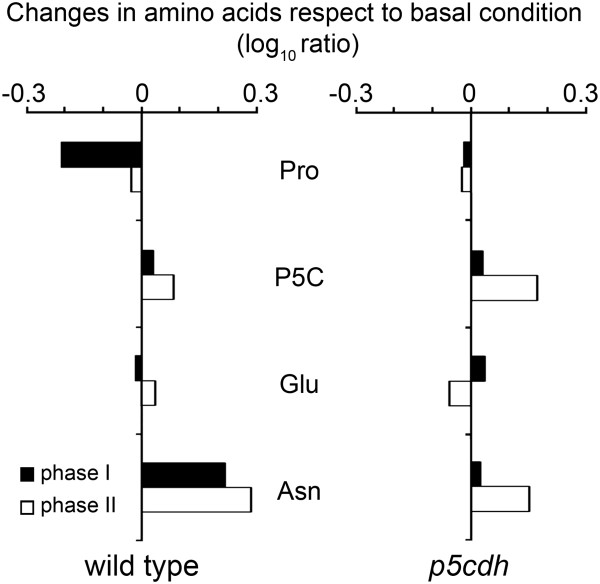
Figure 3.
Changes in the amino acid content in wild type and p5cdh plants. Based on the absolute values shown in Table 2, the ratio between the content of Pro, P5C, Glu or Asn in infection (phases I and II) and basal condition (control) was log transformed (base 10) to compare the responses of wild type and p5cdh plants. Statistical analysis of data is described in legend of Table 2.

