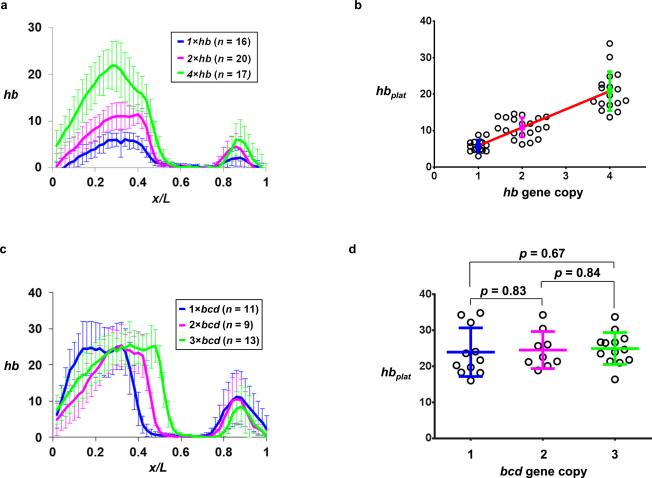
Figure 2. Establishing a platform for quantifying the amplitude of hb transcription.
(a) Shown are the mean profiles (with sd shown) of un-normalized hb mRNA FISH intensities (in arbitrary units) from embryos that have one, two, or four copies of the hb gene. The mean and sd of xhb expressed as fractional embryo length are: 0.435 ± 0.013, 0.445 ± 0.013 and 0.454 ± 0.019 for 1×, 2× and 4×hb embryos, respectively (n = 16, 20 and 17). These results show that xhb remains largely insensitive to changes in hb copy number in our experimental system; a relatively minor shift might be related to the limitations inherent to experimental detections 35.
(b) Shown are hbplat values (in arbitrary units) in individual embryos with different copies of the hb gene. The mean and sd are also shown in the figure (n = 16, 20 and 17 for 1×, 2× and 4×hb embryos, respectively). The linear fit between hbplat and hb gene copy number is shown as a red line in the figure.
(c) Shown are the mean profiles of un-normalized hb mRNA FISH intensities in embryos from mothers with one, two, or three copies of bcd. The mean and sd of xhb expressed as fractional embryo length are: 0.373 ± 0.013, 0.446 ± 0.009, and 0.510 ± 0.010 for 1×, 2× and 3×bcd embryos, respectively (n = 11, 9, and 13).
(d) Shown are hbplat values in individual embryos from mothers with different copies of bcd. The mean and sd of hbplat are: 23.93 ± 6.75, 24.51 ± 5.13, and 24.94 ± 4.42 for 1×, 2× and 3×bcd embryos, respectively (n = 11, 9, and 13). p values (obtained from Student’s t-tests and shown in the figure) reveal no significant differences.

