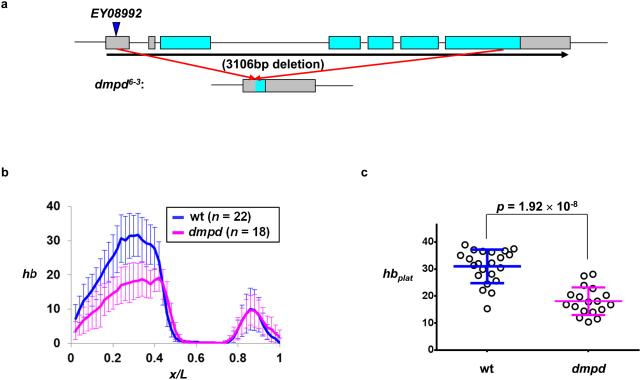
Figure 3. hb mRNA level is reduced in dmpd embryos.
(a) A schematic diagram showing the deletion caused by the dmpd6-3 allele. The boxes represent exons with the annotated open reading frame in cyan and the un-translated regions in grey. The blue arrow shows the P-element insertion site for dmpdEY08992.
(b) Shown are the mean profiles of un-normalized hb mRNA FISH intensities in wt and dmpd embryos (n = 22 and 18, respectively). Note that the level of the Bcd-independent posterior hb expression domain remains unaffected in dmpd embryos (p = 0.93, Student’s t-test); see text and panel c legend for further details). The mean and sd of xhb expressed as fractional embryo length are: 0.433 ± 0.012 and 0.462 ± 0.018 for wt and dmpd embryos, respectively (p = 4.8 × 10⁻⁷, Student’s t-test).
(c) Shown are hbplat values in individual wt and dmpd embryos (n = 22 and 18, respectively). Unlike the significant amplitude reduction for the Bcd-activated anterior hb expression domain shown in this figure, the amplitude of the Bcd-independent posterior hb expression domain, hbpost (defined as the average FISH intensities at the three peak positions of the posterior domain), is insensitive to dmpd mutation.

