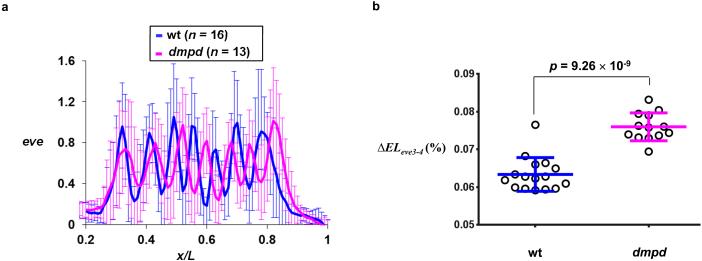
Figure 4. The spacing between eve stripes 3 and 4 is sensitive to the dmpd mutation.
(a) Shown are the normalized mean intensity profiles of eve in wt and dmpd embryos (n = 16 and 13, respectively).
(b) Shown is the calculated distance between eve stripes 3 and 4 in each individual wt and dmpd embryos (n = 16 and 13, respectively). The distance values shown are expressed as percentage of embryo length. Also shown are mean and sd for these two groups, along with the p value obtained from Student’s t-test.

