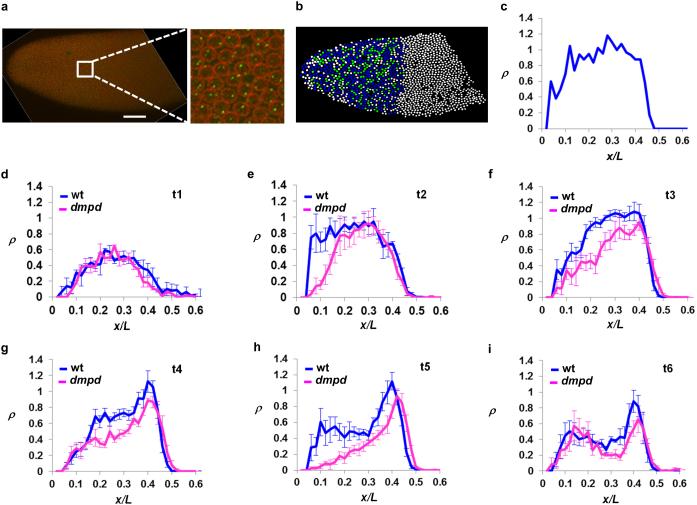
Figure 5. The transcribing probability near Bcd-responsive promoter of hb is decreased in dmpd embryos.
(a) Shown is an image of hb intron staining from a cycle 14 embryo. Nuclear envelope is shown in red and intron dots in green. Scale bar, 50μm. A magnified view of a section of the expression domain is shown on the right side of this panel.
(b) Shown is a computer-processed image of panel a. Here each of the identified nuclei is shown in a color according to the number of intron dots detected inside. White, blue and green represent zero, one and two intron dots detected, respectively.
(c) Shown is the plot of ρ as a function of x/L based on panel b.
(d-i) Shown are the mean ρ profiles from wt and dmpd embryos at time classes t1-t6. The mean and sd of ρplat for t1-t6 time classes are: 0.50 ± 0.07; 0.84 ± 0.04; 1.03 ± 0.08; 0.71 ± 0.14; 0.52 ± 0.10; 0.34 ± 0.03 for wt embryos (n = 3, 3, 7, 7, 5 and 4, respectively) and 0.51 ± 0.11; 0.86 ± 0.25; 0.79 ± 0.21; 0.54 ± 0.06; 0.38 ± 0.12; 0.23 ± 0.05 for dmpd embryos (n = 3, 4, 5, 5, 5 and 4), respectively. The p values (from Student’s t-tests) between wt and dmpd embryos for t1-t6 time classes are: 0.93; 0.92; 0.016; 0.028; 0.078; 0.0087, respectively. The mean ρ at x/L ~0.15 (which is located outside of the plateau domain for calculating ρplat) appears higher in dmpd embryos than in wt embryos at t6 (panel i); this is likely caused by an “outlier” dmpd embryo that has a very high level of ρ at this location (see Fig. S8f).

