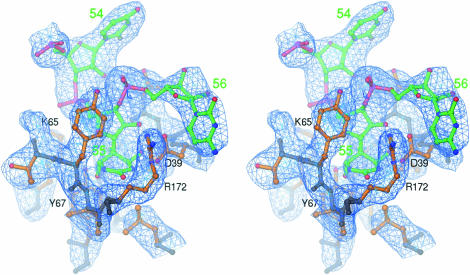
Figure 3.
Stereo view of the simulated annealing Fo – Fc omit map showing electron density for FhΨ55 in the structure of Ψ55S-RNA complex. All atoms within 4 Å were omitted from refinement. The main chains of Ψ55S are grayish blue, the side chains are orange and the RNA is green. The hetero-atoms are colored individually, with nitrogen in blue, oxygen in red and phosphate in magenta. The map is contoured at 3.0 σ.

