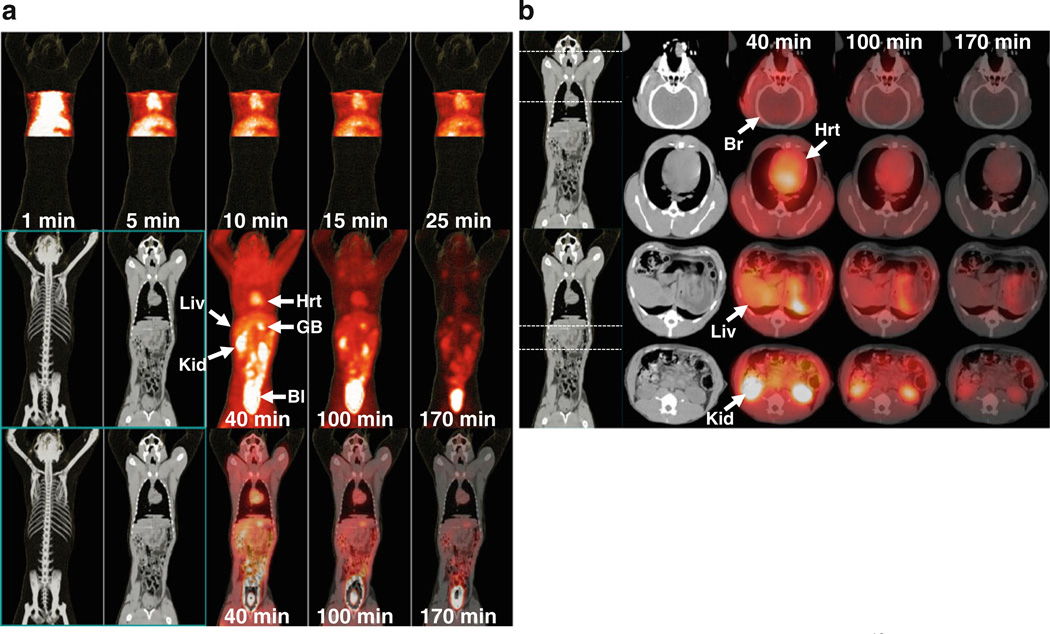
Fig. 3.
PET and PET/CT fusion images obtained at different time points after intravenous injection of 18F-FACE. a Coronal maximum intensity projection (MIP) PET images of the thoracoabdominal section obtained at 1–25 min (top row); whole-body CT and MIP PET images obtained at 40, 100, and 170 min, average frame times (middle row); and corresponding fusion of coronal PET and CT images (bottom row). b Fusion of axial PET and CT images obtained at the level of the brain (top row), heart (second row), liver (third row), and kidneys (bottom row). Different organs are indicated by arrows and labeled as: Br brain, Hrt heart, Liv liver, GB gall bladder, Kid kidney, Bl urinary bladder.

