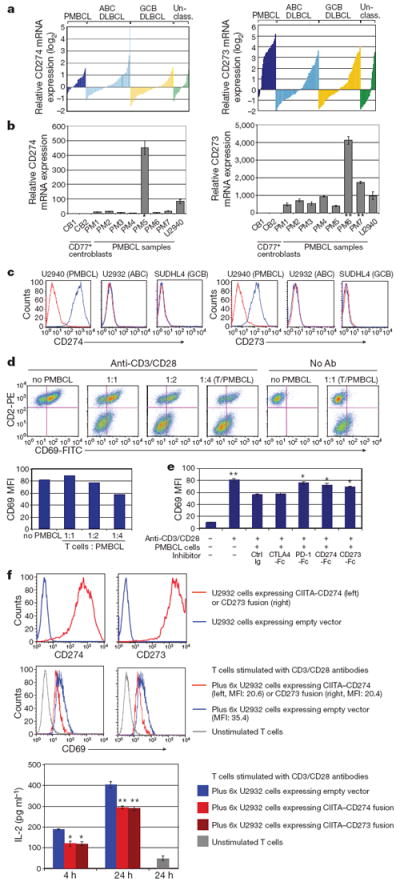
Figure 4. CD274/CD273 expression on PMBCL cells inhibits T-cell activation.

a, mRNA overexpression of CD274 and CD273 in molecular subtypes of DLBCL including PMBCL. Normalized relative log2 ratios are shown (Affymetrix gene expression profiling)23. Probeset intensities of CD274 and CD273 correlate with each other (Pearson coefficient 0.541). b, Fold change of CD274 and CD273 mRNA expression in PMBCL compared with germinal centre B cells including cases with CIITA–CD274 (*), CIITA–CD273 (**) fusions and cell line U2940. c, Flow cytometric analysis of CD274/CD273 expression. Expression levels of CD274 or CD273 (blue histogram) and isotype controls (red histogram) are shown. d, Inhibition of T-cell activation by PMBCL cells. Dot plots and bar graph show that CD69 expression on Jurkat T cells (CD2 positive) is increasingly reduced by co-incubation with increasing numbers of U2940 cells. e, T-cell inhibition is PD1 dependent. CD274-Fc, CD273-Fc, PD1-Fc, CTLA4-Fc or control Ig were added to the co-cultures, respectively, in which Jurkat T cells were mixed with U2940 cells. Mean fluorescence intensities (MFI) are shown. Each bar is the mean of triplicate cultures, the error bars indicating the standard deviation (Student’s t-test, *P < 0.05, **P < 0.01, compared with control Ig). f, Forced expression of CIITA–CD274 and CIITA–CD273 fusion transcripts in U2932. The top panel shows the surface protein expression in transduced cells compared with empty vector control cells. The middle and bottom panels show significantly reduced CD69 expression on Jurkat T cells and IL-2 levels in the supernatant after admixture of CIITA–CD274 and −CD273 fusion-expressing U2932 cells. Each bar is the mean of triplicate cultures, the error bars indicating the standard deviation (Student’s t-test, *P < 0.05, **P < 0.01, compared with the empty vector control).
