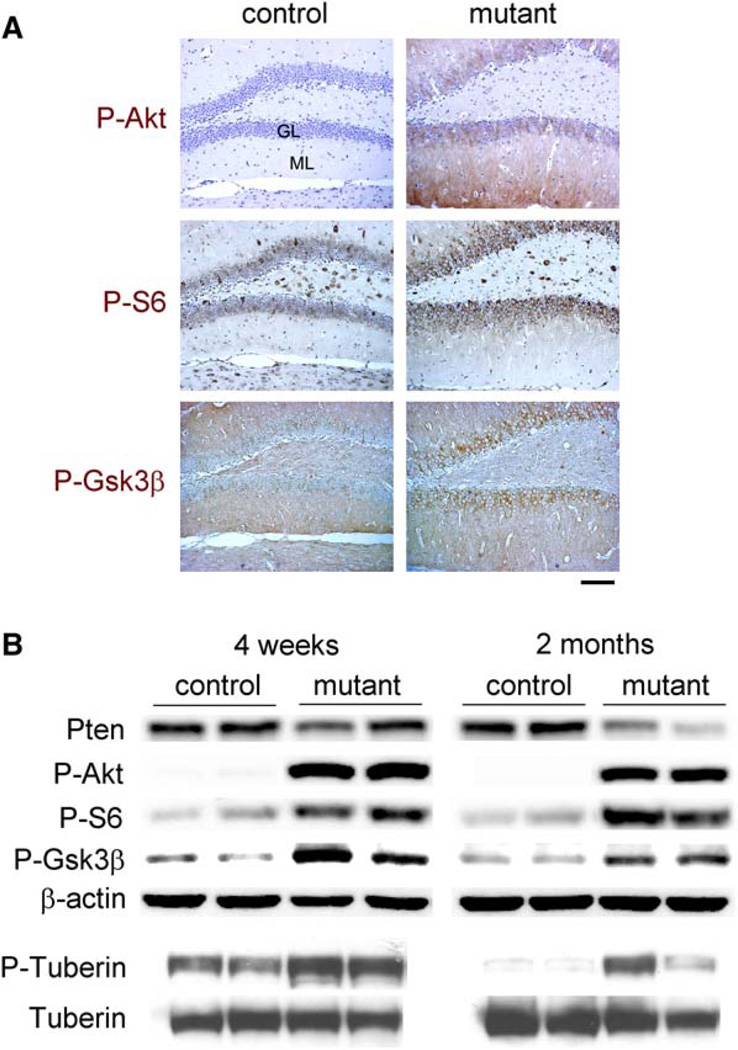
Figure 8. Molecular Signaling Downstream of Pten-Deleted Neurons.
(A) At 2 months of age, mutant dentate gyri exhibited increased signal (brown) for P-Akt, P-S6 and P-Gsk3β, compared to those in control. The increased staining in mutants was apparent in the granular layer (GL) and inner molecular layer (ML) for P-S6 and in the GL for PGsk3β, whereas both the GL and ML displayed increased P-Akt. All sections were counterstained with hematoxylin, except for P-Gsk3β panels that were stained with methyl green. Scale bar, 200 µm.
(B) Western blot analysis showed decreased Pten and increased P-Akt, P-S6, P-Gsk3β, and P-Tuberin in mutant versus control at all ages tested. p < 0.005 for Pten at 2 months and P-Akt; p < 0.1 for P-S6, P-Gsk3β and P-Tuberin.

