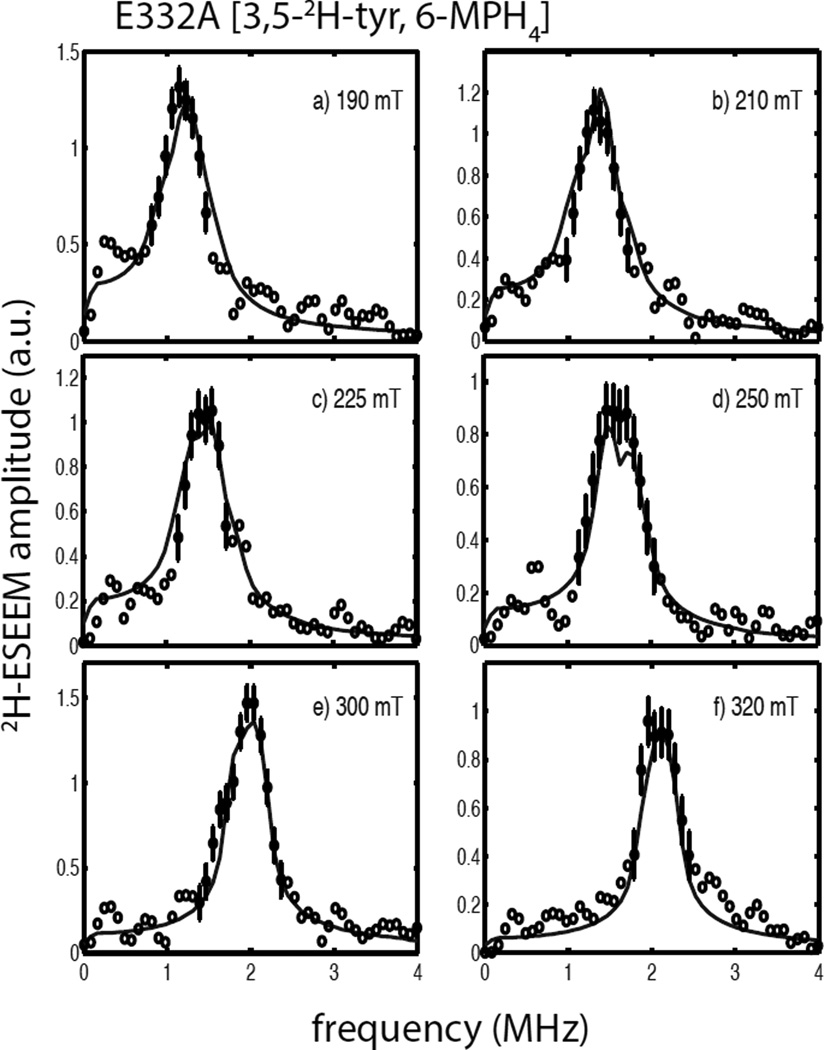
Figure 8.
2H-ESEEM spectra (open and filled circles) obtained by Fourier transformation of ESEEM data from the ternary complexes of E332A/NO/3,5-2H-tyr/6-MPH4 divided by E332A/ NO/3,5-2H-tyr/6-MPH4. Data were collected at 9.68 GHz using the following field positions and tau values a) 190 mT, 124 ns; b) 210 mT, 112 ns; c) 225 mT, 104 ns; d) 250 mT, 92 ns; e) 300 mT, 156 ns; and f) 320 mT, 148 ns. The solid lines in each frame are best fit ESEEM simulations to the data points represented by the filled circles with error bars using the following spin Hamiltonian parameters: gn = 0.8574, T = 0.12 MHz, βhf = 89°, γhf = 20°, e2qQ/h = 0.29 MHz, βnqi = 44° and γnqi = 34°.

