Figure 2.
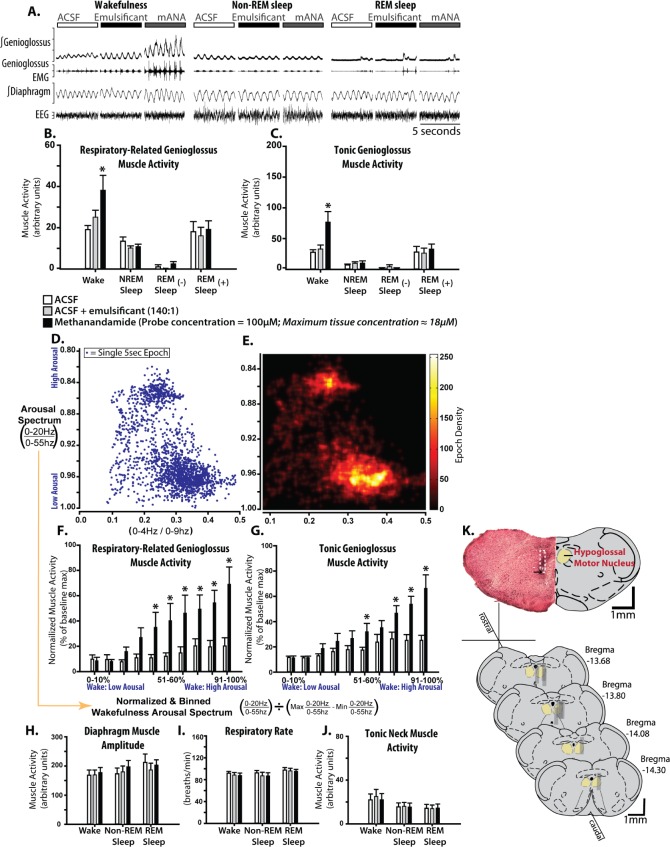
Microperfusion of methanandamide into the hypoglossal motor pool activates genioglossus muscle activity exclusively in wakefulness. (A) Example in one rat showing genioglossus muscle activity during microperfusion of: artificial cerebrospinal fluid (ACSF) (control), a water soluble emulsificant (control) and 100 μM emulsified methanandamide into the hypoglossal motor pool across sleep-wake states. Note the selective genioglossus muscle activation by methanandamide compared to controls. Group data (n = 9) showing the effects of methanandamide on respiratory-related (B) and tonic (C) genioglossus muscle activities during wakefulness, non-REM, and REM sleep with ([-]) and without ([+]) muscle twitching, compared with ACSF and emulsificant controls. (D) A scatterplot bounded by two electroencephalographic ratios showing the position of 5-sec segments of wakefulness and non-REM sleep in a two-dimensional state-space. (E) A density plot of the points in D. Note that in D and E, separate wake and non-REM sleep clusters are visible along the y-axis, meaning that the spectral power ratio (0-20Hz/0-55Hz) is an effective indicator of the arousal spectrum (high in wake to low in non-REM sleep). (F and G) Group data showing the effects of methanandamide on respiratory and tonic genioglossus muscle activities during waking epochs as a function of waking arousal level identified previously. Note the relationship between increased level of arousal and increased methanandamide-mediated genioglossus muscle activation. The lack of effect of methanandamide across sleep-wake states on the control variables are shown in H-J for diaphragm amplitude, respiratory rate and tonic neck muscle activity. (K) Example and group data showing the location of microdialysis probes from coronal sections. The example from a single animal indicates the site of microdialysis within the hypoglossal motor pool. The location of the ventral tip of the probe site is indicated by the black arrow and the approximate position of the entire microdialysis probe membrane is denoted by the white dotted section. The locations of all the sites of microdialysis are also shown. Gray rectangles represent the space occupied by the semi-permeable membrane portion of the microdialysis probes. Values are means ± standard error of the mean. Asterisk indicates significant effect of methanandamide compared with controls (P < 0.05, from analysis of variance). mANA, methanandamide.

