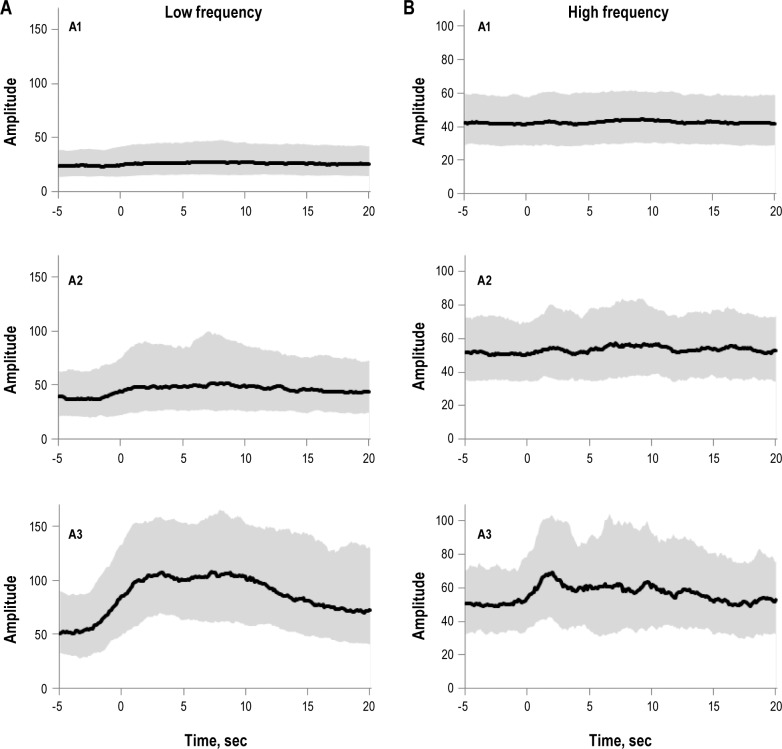
Figure 2.
Comparison of time course in heart rate variability before and after the onset of CAP phase A. The median value (black line) of each CAP subtype was calculated (A, B) and graphed. Gray shadows indicate interquartile range of low frequency (LF: 0.04 to 0.15 Hz) and high frequency (HF: 0.15 to 0.4 Hz). Zero seconds indicates the onset of phase A. The amplitude of LF was the highest in subtype A3, followed by subtypes A2 and A1.

